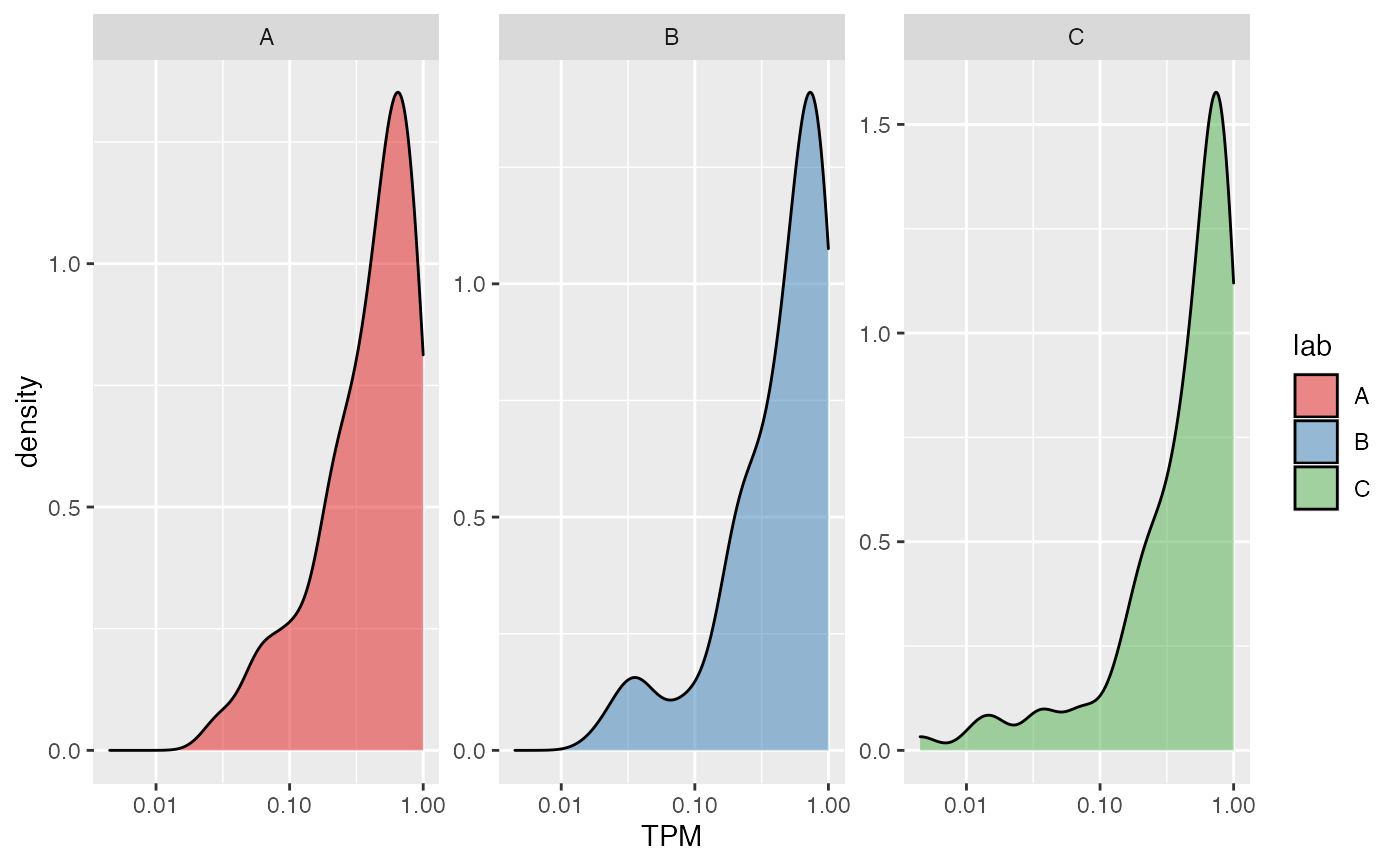
Generate a density-plot of expression of selected genes, faceted by selected feature
density_plotter.RdGenerate a density-plot of expression of selected genes, faceted by selected feature
density_plotter(expression_df, feature_label)
Arguments
| expression_df | Data frame containing expression values. |
|---|---|
| feature_label | Label in the data frame to facet by. |
Value
p A ggplot object containing the generated plot
Examples
df <- tibble::tibble(TPM = runif(300),
                     lab = rep(c('A', 'B', 'C'), 100),
                     gene = rep(c('A', 'B', 'C'), 100))
density_plotter(df, feature_label = "lab")