Draw Volcano Plot for APS DE Comparison
aps_volcano_plot.RdDraw Volcano Plot for APS DE Comparison
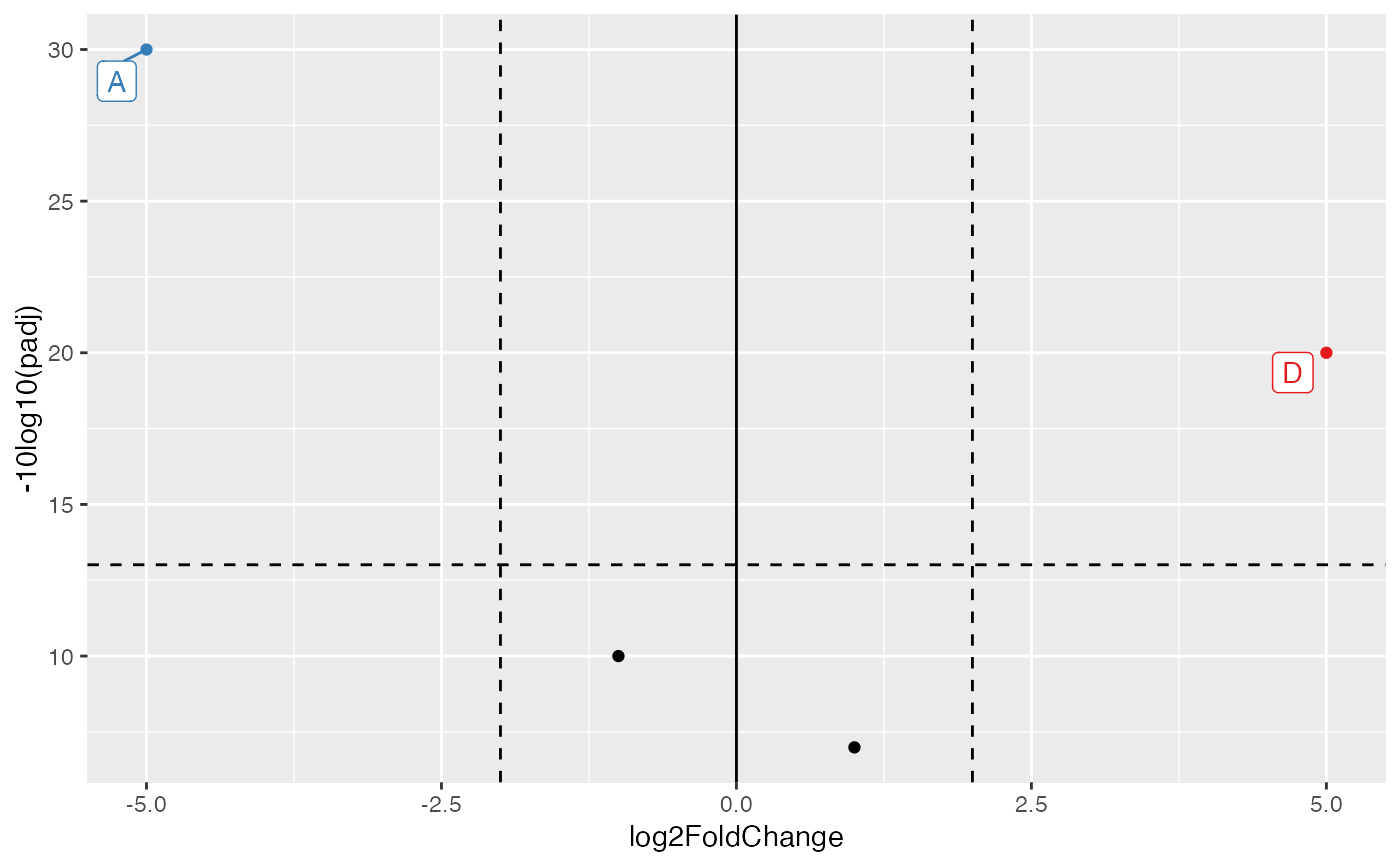
aps_volcano_plot(
  df,
  q_threshold,
  fc_threshold,
  label_q_threshold,
  label_fc_threshold,
  draw_labels = FALSE
)
Arguments
| df | Data-frame containing DE results. |
|---|---|
| q_threshold | Q-threshold for colouring points. |
| fc_threshold | Fold-change threshold for colouring points. |
| label_q_threshold | Q-value threshold for adding labels. |
| label_fc_threshold | Fold-change threshold for adding labels. |
| draw_labels | Boolean - add labels? |
Value
A ggplot object
Examples
df <- tibble::tibble(gene_name = c('A', 'B', 'C', 'D'),
                     padj = c(0.001, 0.1, 0.2, 0.01),
                     log2FoldChange = c(-5, -1, 1, 5),
                     `-10log10(padj)` = c(30, 10, 6.9897, 20))
aps_volcano_plot(df, q_threshold = 0.05, fc_threshold = 2,
                 label_q_threshold = 0.05, label_fc_threshold = 2,
                 draw_labels = TRUE)